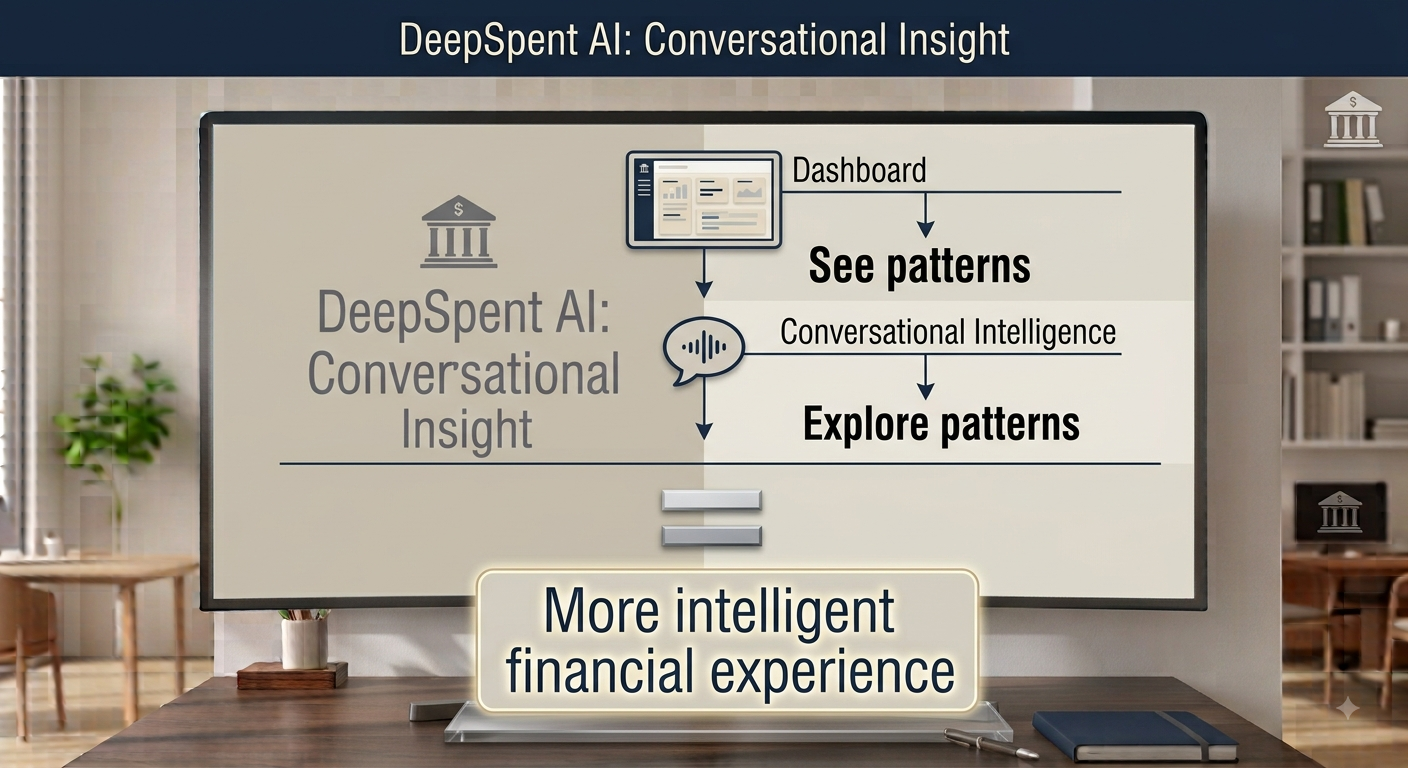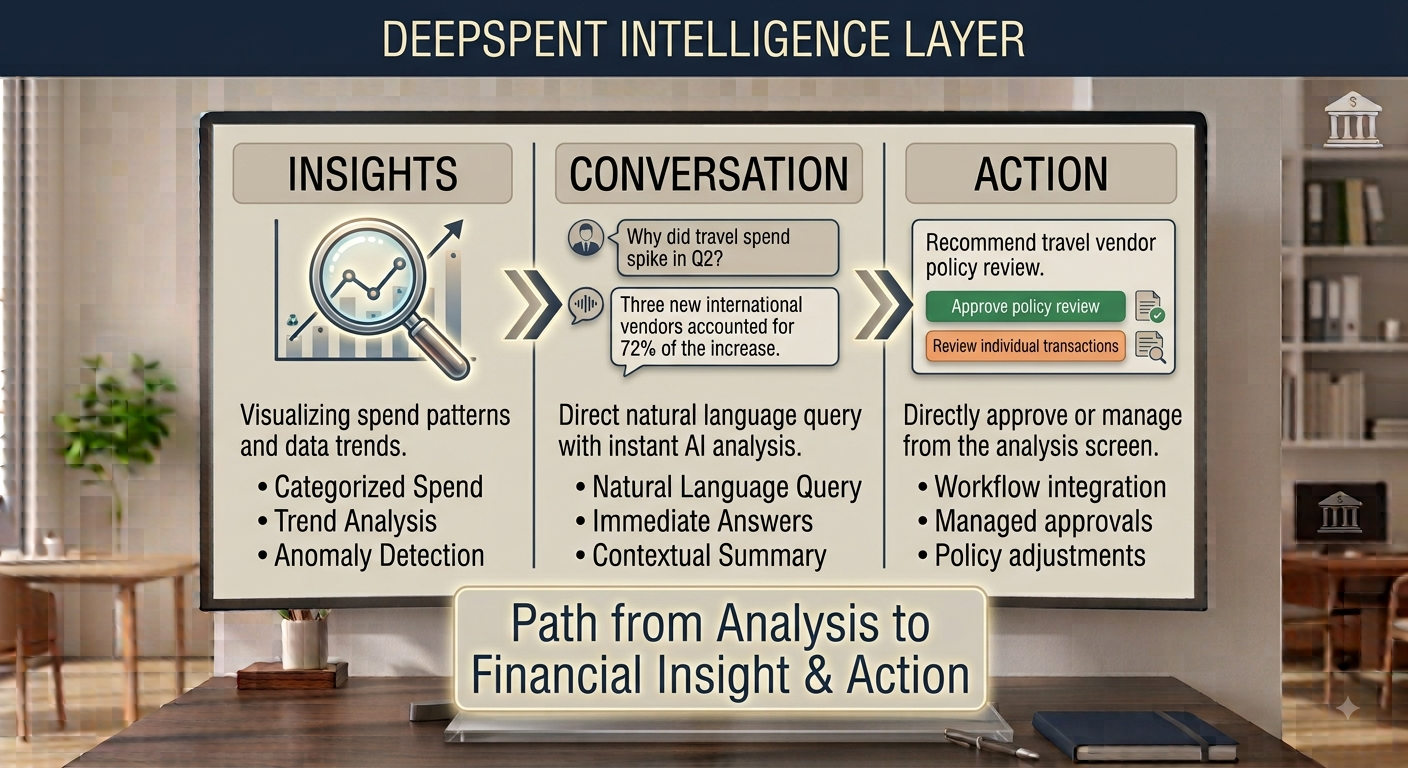
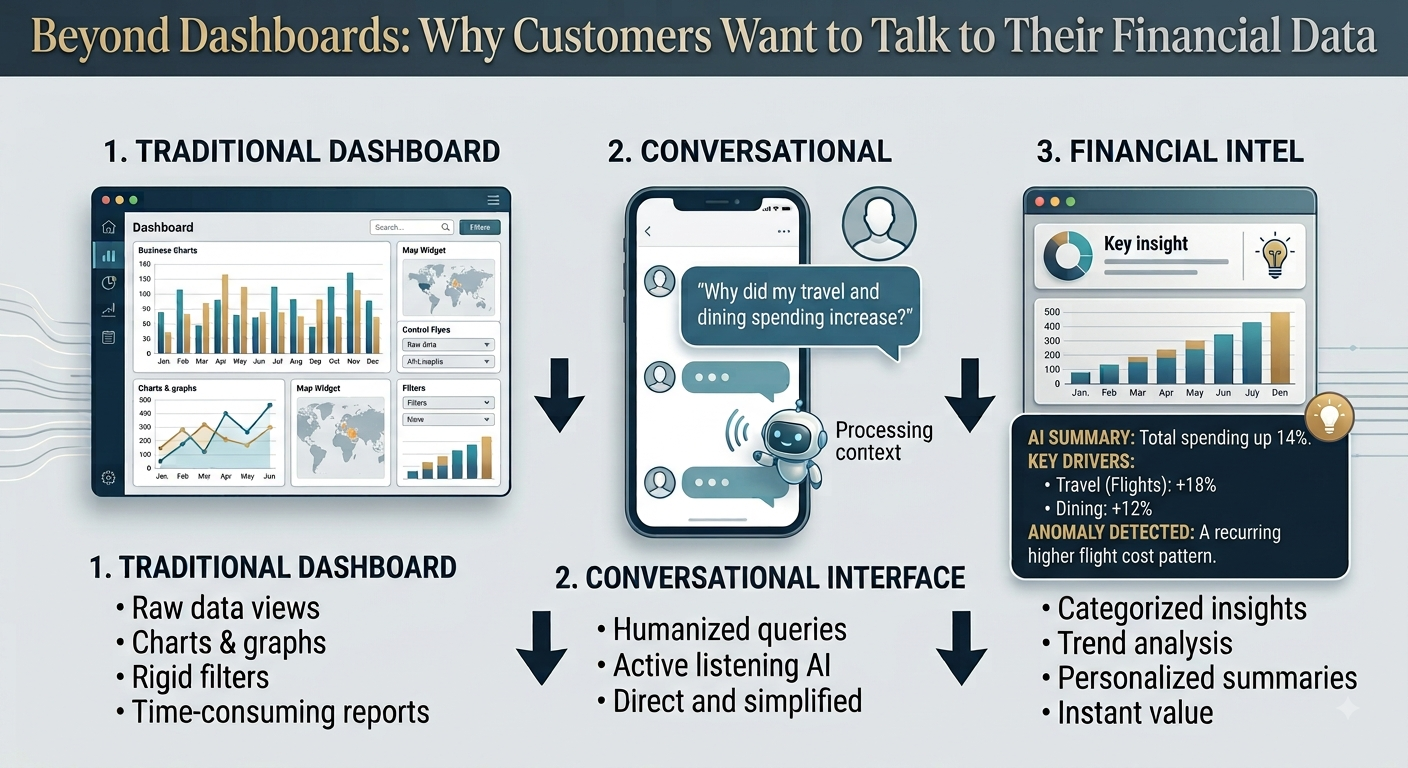
The Dashboard Era: Making Data Visible
Traditional financial dashboards were designed around a simple principle:
If you organize data well, users can find the information they need.
A typical financial dashboard might include:
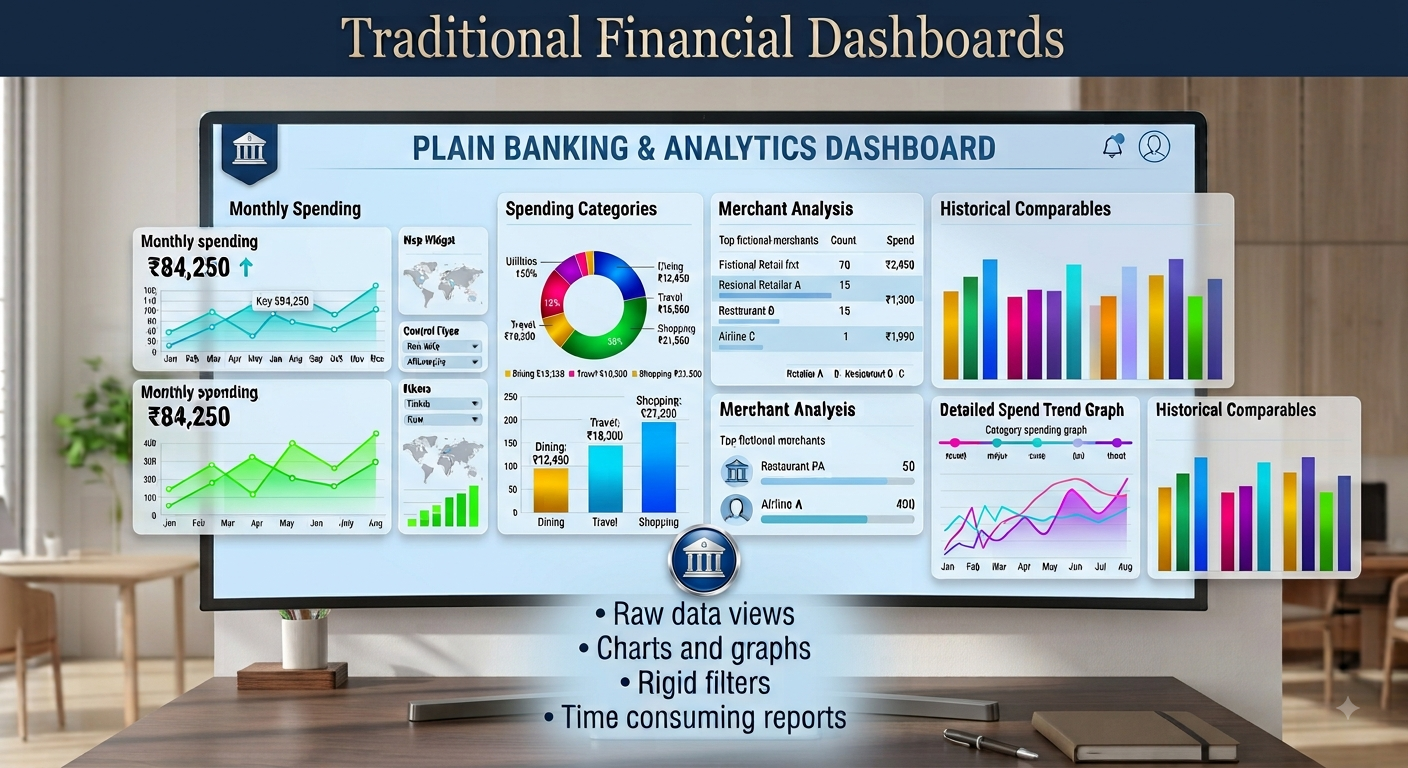
These interfaces remain useful. Dashboards are excellent for monitoring, comparing, and visualizing information.
But they also require users to know where to look.
A customer who wants to understand a particular spending pattern may need to:
- Open the dashboard.
- Navigate to the spending section.
- Select a date range.
- Choose a category.
- Apply filters.
- Review a chart.
- Interpret the results.
For simple questions, this works.
For more complex questions, the experience can become cumbersome.
And that is where conversational interfaces introduce a fundamentally different approach.